
Trends
every module's safety data, on one timeline
How to read safety activity across your whole program - hazards, inspections, incidents and more - for one site and any date range, and export it as a report.
Short answer
ShieldSphere's Trends module is the wide view: safety activity across every module for one site on a single screen, for any date range you choose. It counts hazards from AI scans and inspections together, plots incidents over time, and shows ZeroState and asset activity side by side - the screen to open before a management review or safety-committee meeting.
1What Trends does
Trends is the wide view - safety activity across every module for a site, on one screen, so you can see the patterns no single module shows.
Where each module's own trends tab tells you about that module, this one puts them side by side: hazards from AI scans and inspections counted together, incidents over time, ZeroState and asset activity - all for the site and date range you choose. It is the screen to open before a management review or a safety-committee meeting.
Trends shows one site at a time and only reads data - nothing here changes a record. To act on what you see, open the module the data came from.
2Controls: site, dates, export
Three controls sit at the top right of every Trends view:
| Control | What it does |
|---|---|
| Profile | The site the trends are drawn from. Switch it to see another site's data. |
| Date range | The window the charts cover - for example the last 90 days. Widen it to see longer-term patterns. |
| Export PDF | Saves the current view as a report - the one to attach to meeting minutes or send up the chain. |
3Hazard categories across sources
The flagship view: the same hazard counted wherever it turned up, so a recurring problem cannot hide by being split across modules.
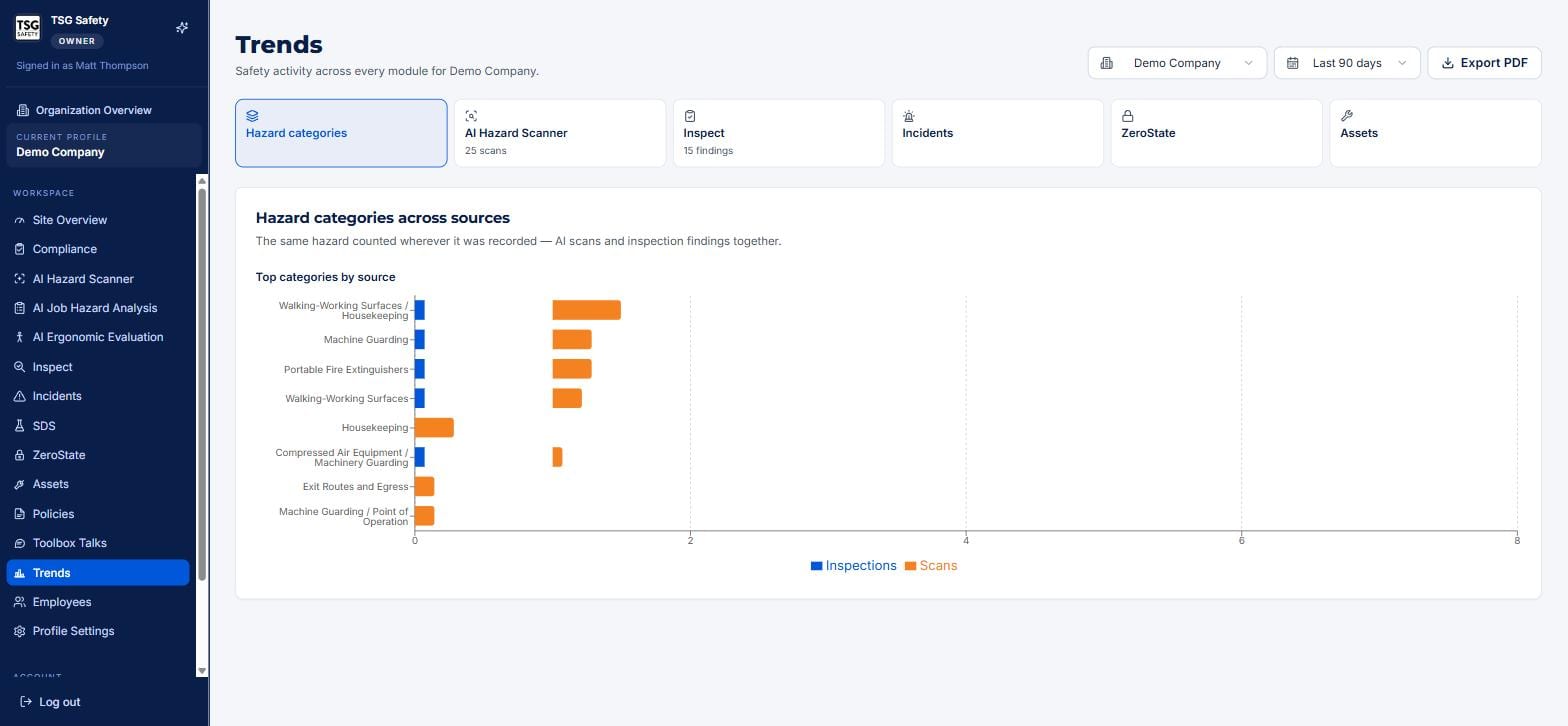
The categories at the top of this chart are your programme's real weak points. A hazard that shows up in both inspections and scans, again and again, is the one to spend training and capital on.
4The per-module tabs
The tabs across the top - AI Hazard Scanner, Inspect, Incidents, ZeroState, Assets - each open that module's trend view, with a count on the tab so you can see volume at a glance.
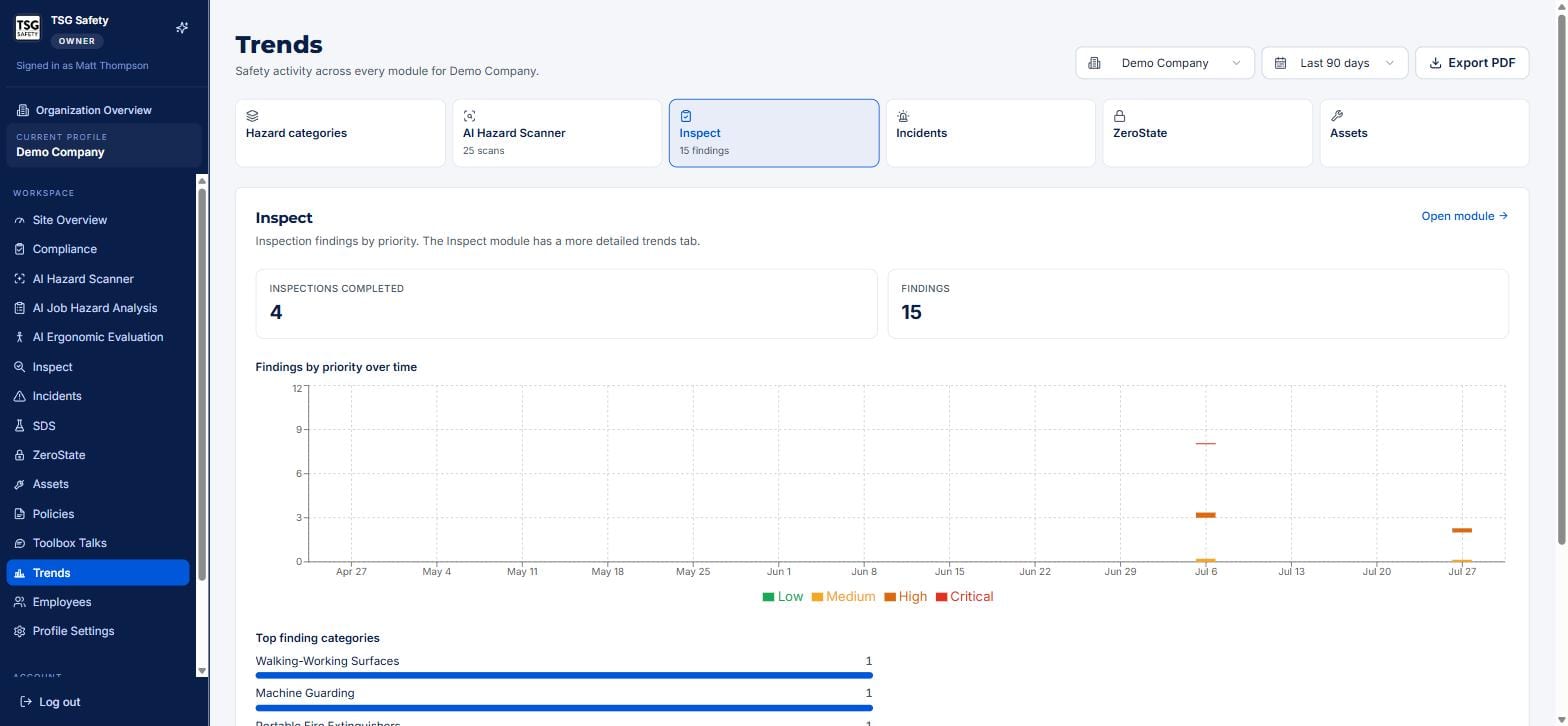
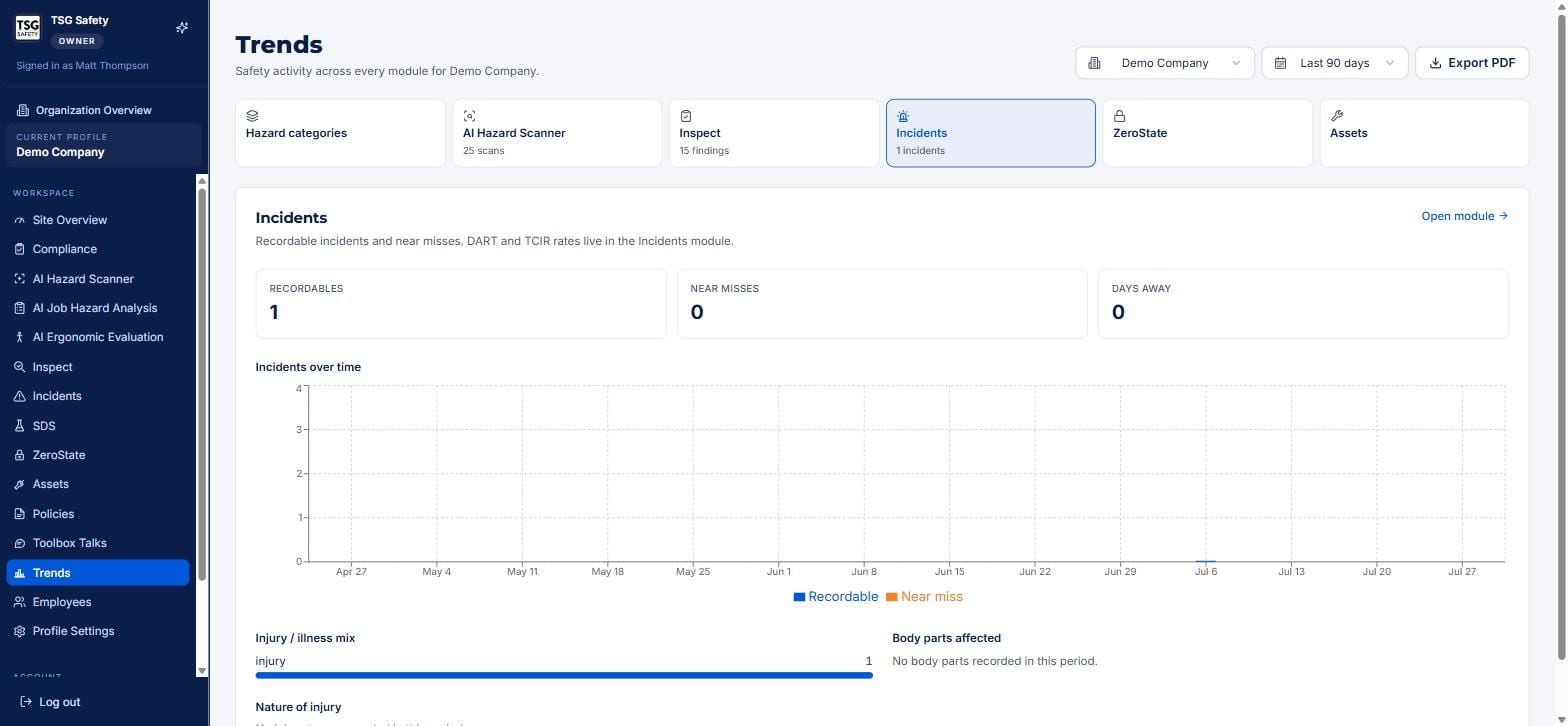
Each tab is a summary. When a chart raises a question, the Open module link takes you to that module's fuller trends and the records behind them.
5Making it useful
A trend only matters if it changes what you do. Two habits get the most out of this screen:
- Compare windows. Set the date range to this quarter, then last quarter. A hazard category that is shrinking says your fixes are working; one that is flat or growing says they are not.
- Export for the record. Use Export PDF to capture the view for a safety-committee meeting - it turns "I think things are improving" into a chart everyone can see.
6Troubleshooting
| Symptom | Cause and fix |
|---|---|
| A chart is empty | No data in the selected date range. Widen the range, or confirm the module has records for this site. |
| The numbers look low | Check the date range - a short window shows less. It is the pattern over time, not the raw count, that matters. |
| I need the detail behind a chart | Use Open module on that tab to see the fuller trends and the underlying records. |
| This is the wrong site | Change the profile selector top-right - Trends shows one site at a time. |
| I need to share this | Use Export PDF to save the current view as a report. |
Try Trends in ShieldSphere
Start a free hazard scan and see the platform these guides describe - no credit card required.
Screens captured from the live application in July 2026 using a demonstration site - your screens will show your own data. Because ShieldSphere ships changes regularly, check the version above against the current release before circulating this guide widely. Questions? Contact support.